Why is candy so expensive this Halloween?
Candy costs 47% more than in 2020, while Halloween candy budgets rose 26%. Prices are still climbing, up 7.7% in the past year against 3.7% for all prices. Cocoa is the main reason. Its price more than quadrupled to a record in early 2025. It has fallen by 45% since, but candy makers lock in cocoa prices up to two years ahead, so the record costs are reaching the shelves now.
Candy prices rose 47% since 2020, Halloween candy budgets 26%
Planned candy spending per person celebrating went from $28 to $35. In the 2010s it was the other way round: budgets rose 36%, prices 17%. Change since September 2020, or since 2010 on the second tab.
| Year | Budget | Budget since 2020 | Candy prices since 2020 |
|---|---|---|---|
| 2026 | $34.79 | +26% | +47% |
| 2025 | $34.24 | +24% | +37% |
| 2024 | $31.69 | +15% | +24% |
| 2023 | $31.93 | +16% | +24% |
| 2022 | $29.51 | +7.1% | +15% |
| 2021 | $30.40 | +10% | +2.0% |
| 2020 | $27.55 | 0% | 0% |
| 2019 | $25.37 | – | – |
| 2018 | $25.47 | – | – |
| 2017 | $25.27 | – | – |
| 2016 | $24.43 | – | – |
| 2015 | $23.10 | – | – |
| 2014 | $23.39 | – | – |
| 2013 | $22.37 | – | – |
| 2012 | $23.27 | – | – |
| 2011 | $21.05 | – | – |
| 2010 | $20.29 | – | – |
Each year since 2010: planned candy spending per person, the candy and all-items price indexes for September, and the change since 2010 and since 2020, as a gzipped CSV.
Download CSV (gzip)Cocoa costs fell, candy prices kept rising
Change since December 2019. The BLS article's version of this chart stops in November 2024.
Up to and including Sep 2026
Monthly average, US dollars a metric ton. The futures record of $12,565 in December 2024 was a daily price.
| Month | Cocoa imports | Candy makers' prices | Candy in stores |
|---|---|---|---|
| Sep 2026 | +124% | +27% | +52% |
| Aug 2026 | +122% | +28% | +51% |
| Jul 2026 | +118% | +27% | +52% |
| Jun 2026 | +120% | +26% | +52% |
| May 2026 | +124% | +26% | +50% |
| Apr 2026 | +136% | +26% | +47% |
| Mar 2026 | +148% | +25% | +50% |
| Feb 2026 | +154% | +25% | +52% |
| Jan 2026 | +156% | +24% | +47% |
| Dec 2025 | +160% | +24% | +46% |
| Nov 2025 | +152% | +23% | +45% |
| Oct 2025 | +179% | +23% | – |
| Sep 2025 | +167% | +19% | +41% |
| Aug 2025 | +174% | +19% | +40% |
| Jul 2025 | +188% | +19% | +39% |
| Jun 2025 | +195% | +18% | +39% |
| May 2025 | +218% | +18% | +37% |
| Apr 2025 | +198% | +17% | +37% |
| Mar 2025 | +221% | +15% | +36% |
| Feb 2025 | +192% | +15% | +36% |
| Jan 2025 | +169% | +17% | +37% |
| Dec 2024 | +128% | +16% | +33% |
| Nov 2024 | +107% | +14% | +32% |
| Oct 2024 | +106% | +13% | +30% |
| Sep 2024 | +107% | +13% | +28% |
| Aug 2024 | +118% | +11% | +29% |
| Jul 2024 | +129% | +9.6% | +29% |
| Jun 2024 | +135% | +9.3% | +29% |
| May 2024 | +138% | +9.1% | +29% |
| Apr 2024 | +166% | +9.1% | +29% |
| Mar 2024 | +93% | +8.5% | +29% |
| Feb 2024 | +59% | +8.3% | +31% |
| Jan 2024 | +40% | +7.4% | +30% |
| Dec 2023 | +34% | +7.1% | +28% |
| Nov 2023 | +29% | +6.9% | +28% |
| Oct 2023 | +26% | +6.7% | +27% |
| Sep 2023 | +24% | +6.7% | +28% |
| Aug 2023 | +23% | +7.1% | +28% |
| Jul 2023 | +22% | +7.7% | +27% |
| Jun 2023 | +19% | +6.9% | +27% |
| May 2023 | +17% | +6.2% | +24% |
| Apr 2023 | +20% | +5.7% | +24% |
| Mar 2023 | +14% | +5.4% | +23% |
| Feb 2023 | +12% | +5.1% | +23% |
| Jan 2023 | +12% | +4.8% | +24% |
| Dec 2022 | +10% | +5.4% | +22% |
| Nov 2022 | +9.4% | +5.8% | +20% |
| Oct 2022 | +0.8% | +5.2% | +20% |
| Sep 2022 | +1.1% | +4.8% | +19% |
| Aug 2022 | +0.8% | +4.5% | +17% |
| Jul 2022 | +1.0% | +3.9% | +15% |
| Jun 2022 | +0.3% | +2.3% | +12% |
| May 2022 | +0.9% | +2.1% | +11% |
| Apr 2022 | +0.9% | +1.5% | +12% |
| Mar 2022 | +1.4% | +1.1% | +13% |
| Feb 2022 | +2.0% | +0.3% | +12% |
| Jan 2022 | +0.6% | -0.1% | +10% |
| Dec 2021 | -1.6% | -1.0% | +9.0% |
| Nov 2021 | -1.0% | -0.9% | +6.7% |
| Oct 2021 | -1.5% | -1.9% | +5.2% |
| Sep 2021 | -1.1% | -2.4% | +5.3% |
| Aug 2021 | -4.0% | -3.2% | +5.2% |
| Jul 2021 | -4.8% | -4.0% | +4.7% |
| Jun 2021 | -3.6% | -4.4% | +5.0% |
| May 2021 | -3.1% | -4.9% | +4.9% |
| Apr 2021 | -3.4% | -4.9% | +4.1% |
| Mar 2021 | -1.7% | -5.2% | +4.7% |
| Feb 2021 | -1.6% | -5.7% | +4.2% |
| Jan 2021 | -2.2% | -5.8% | +5.2% |
| Dec 2020 | -0.8% | -5.8% | +4.3% |
| Nov 2020 | -1.6% | -5.1% | +3.5% |
| Oct 2020 | -1.4% | -2.0% | +3.5% |
| Sep 2020 | -1.4% | -1.6% | +3.2% |
| Aug 2020 | -2.4% | -2.1% | +1.7% |
| Jul 2020 | -2.1% | -1.5% | +0.4% |
| Jun 2020 | 0% | -1.6% | +1.6% |
| May 2020 | -0.4% | -1.0% | +2.4% |
| Apr 2020 | -0.8% | -1.3% | +2.5% |
| Mar 2020 | +4.2% | -0.5% | +2.3% |
| Feb 2020 | +1.5% | -0.2% | +1.7% |
| Jan 2020 | +0.1% | +0.1% | +2.4% |
| Dec 2019 | 0% | 0% | 0% |
Each month since December 2019: the change in cocoa import prices, candy ingredient and candy maker prices, and candy prices in stores, as a gzipped CSV.
Download CSV (gzip)Why candy still costs more
- A cocoa shock. Côte d'Ivoire and Ghana grow over half the world's cocoa. Heat, drought, then heavy rain and crop disease cut world output by more than 13% in the 2023–24 season, and cocoa futures hit a record of $12,565 a ton in December 2024 (BLS). Futures fell to about $2,850 in March 2026 and climbed back to about $5,600 by late October on fears of an El Niño (Barchart).
- Bought ahead. Candy makers lock in cocoa prices long before the beans reach a bar: Hershey hedges 3 to 24 months ahead. Cocoa import prices peaked in Mar 2025 and are down 30% since, but what candy makers charge is close to its highest and up 6.8% on a year ago.
- Halloween's turn. Hershey's 2025 price rise left out Halloween packs. In July 2026 it told investors to expect “high single-digit” seasonal price rises in the last quarter of the year (earnings call).
- Not tariffs on cocoa. Cocoa beans have been exempt from US reciprocal tariffs since November 2025. Chocolate from the EU pays a 10% tariff since July 2026.
- Protected sugar. The US sugar program limits imports, so US sugar costs about twice the world price. A drought in Mexico, the largest supplier, cut its shipments to the US in 2023–24 (BLS).
- Smaller packs count as price rises. BLS adjusts for package size. Downsizing added 2.1% to candy and gum prices from January 2019 to October 2023 (BLS).
US sugar costs 2.1 times the world price
Raw sugar, US cents a pound, monthly average since 2000.
What a bag costs at a large US retailer this week
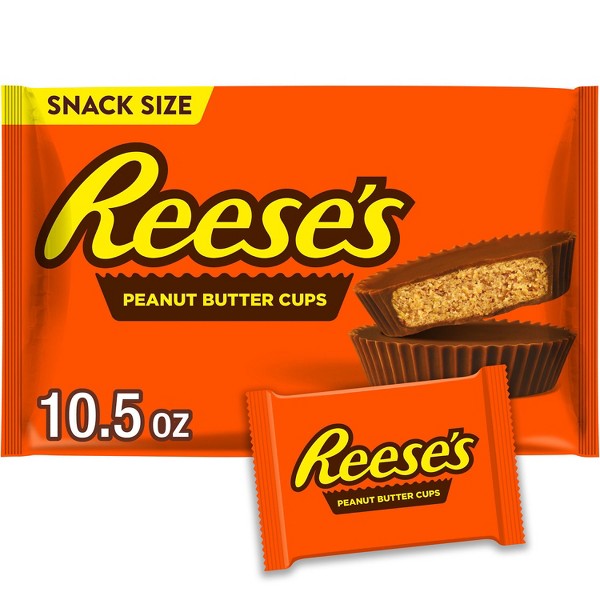
Reese's Cups
$6.29
10.5 oz bag
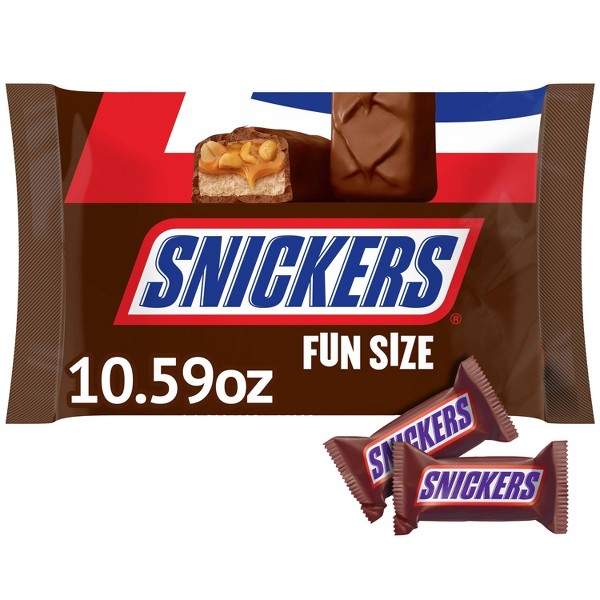
Snickers Fun Size
$6.19
10.6 oz bag
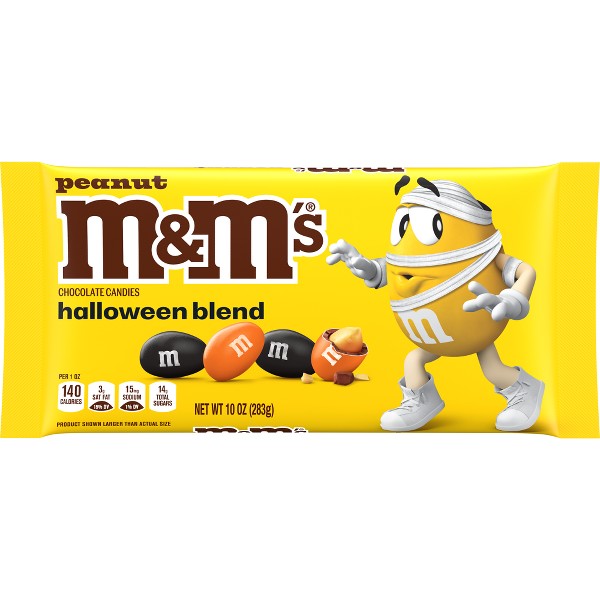
M&M's Peanut
$5.89
10 oz bag
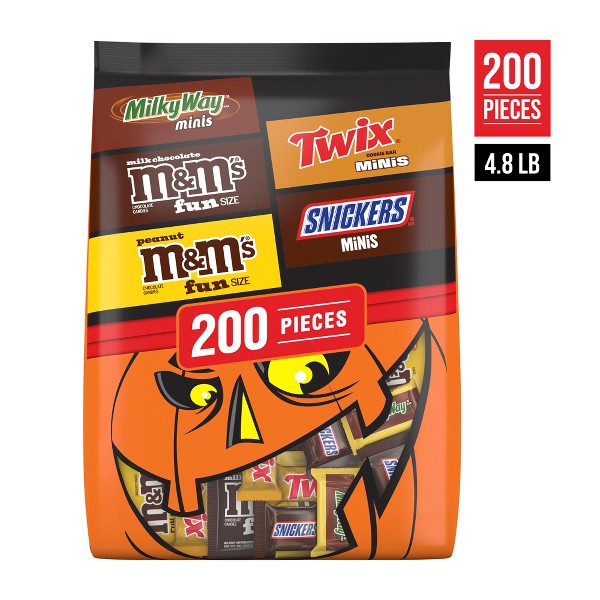
Mars variety bag
$25.99
200 pieces, 13¢ each
| Product | Price |
|---|---|
| Reese's Cups | $6.29 |
| Snickers Fun Size | $6.19 |
| M&M's Peanut | $5.89 |
| Mars variety bag | $25.99 |
About the data
- The cost chain follows the BLS Monthly Labor Review article “Why is candy so expensive these days?” by Natalie Ho (September 2026), which charts the same four indexes from December 2019 to November 2024. Here they run to Sep 2026. Cocoa imports is the import price index for cocoa and cocoa preparations; candy ingredients the producer price index for confectionery materials, such as cocoa products and sweeteners; candy makers' prices the one for confectionery end products. All are not seasonally adjusted.
- The budget chart starts in September 2020, the last year before the price surge. From 2010 both rose about the same, budgets 71% and prices 72%: budgets grew faster in the 2010s and prices caught up after 2020. Starting in 2019 or 2021 shows the same gap.
- The NRF figures are what adults celebrating Halloween planned to spend on candy, not what they paid at the till. The 2026 survey asked 7,889 adults from September 1 to 9.
- Candy prices are the BLS consumer price index for candy and chewing gum, not seasonally adjusted. BLS counts a smaller pack at the same price as a price rise.
- Bag prices are national online prices from one day. Store prices and sales can differ.